

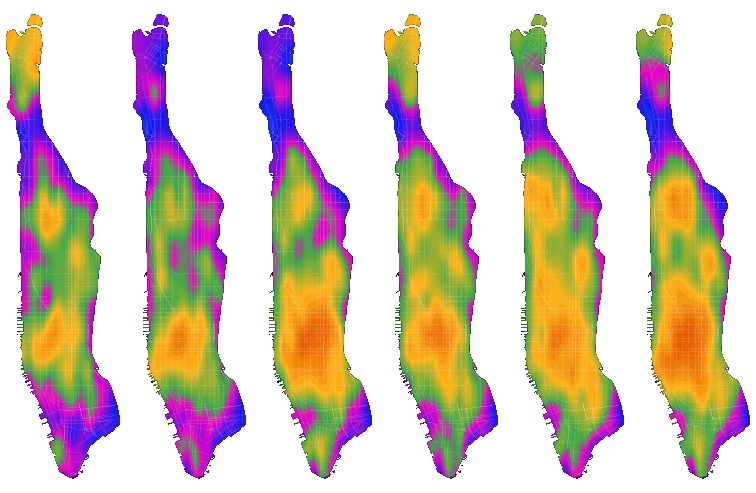
Manhattan’s pedestrian pulse, reconstructed as a changing density field from public camera observations.
Today I’m announcing klosr, a spatial intelligence platform from aimez.ai. Its first pilot brings modeled shade and observed sidewalk occupancy into pedestrian route evaluation across Manhattan. An interactive feature demo is now live at klosr.aimez.ai, with early test access opening soon.
A route on a map becomes a walk once someone steps onto the street. Distance and travel time remain the default measures for comparing pedestrian routes. Neither measure expresses the shade or sidewalk occupancy encountered from block to block. klosr gives each street edge a condition cost before candidate paths are ranked. The recommendation can change as those conditions accumulate across the walk.
klosr brings street conditions into the route before the walk begins
Standard pedestrian navigation prioritizes distance or travel time alone, ignoring dynamic street conditions such as shade exposure and sidewalk crowding. Because a single block carries variable physical costs across the day, static distance metrics cannot represent human-scale walking choices. klosr addresses this limitation by projecting camera observations and reconstructed ground shade onto a walk-graph, producing interpretable comfort-efficiency trade-offs for pedestrian route choice.
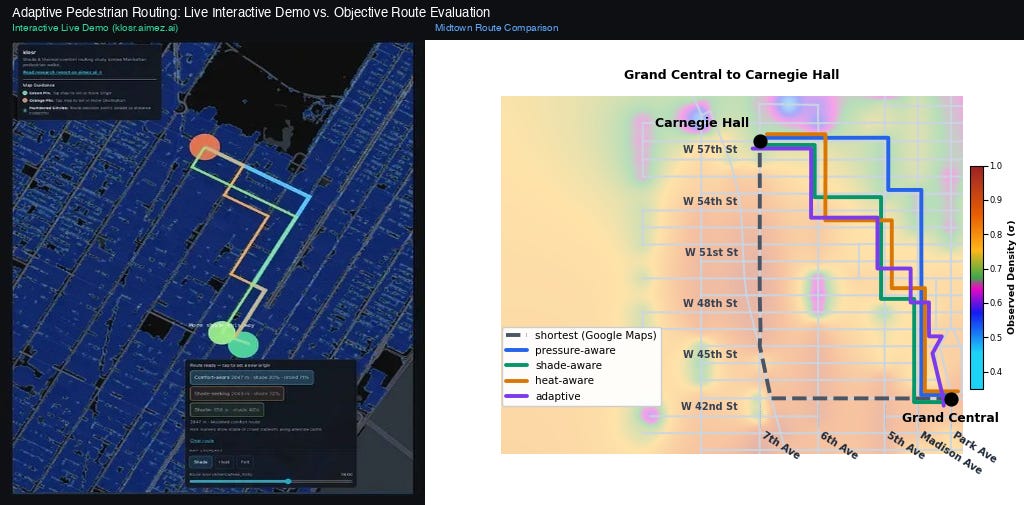
Route evaluation from Grand Central to Carnegie Hall. Sidewalk crowding diverts the adaptive route around dense Midtown crosswalks.
What happens when shade and sidewalk crowding become part of the route?
Two routes can cover the same distance and expose a walker to different conditions. Shade moves across the day while sidewalk occupancy changes by place and time. A route model can compare physical exposure only after each condition has been assigned to the walk graph.
Research on pedestrian route choice describes a context-dependent process shaped by perceived environmental attributes. Recent comfort-aware routing work translates thermal exposure into graph costs by assigning temperature and canopy data to street-network edges.
klosr assigns modeled shade and observed sidewalk occupancy to the Manhattan walk graph. Edge costs accumulate along each candidate path, so local conditions can change which route ranks first.
Pedestrian routing forms the initial evaluation zone because every path passes through a sequence of local conditions. The Manhattan pilot tests how accumulated shade and sidewalk occupancy change route rankings.
Mapping street observations into physical walk-graph edge costs
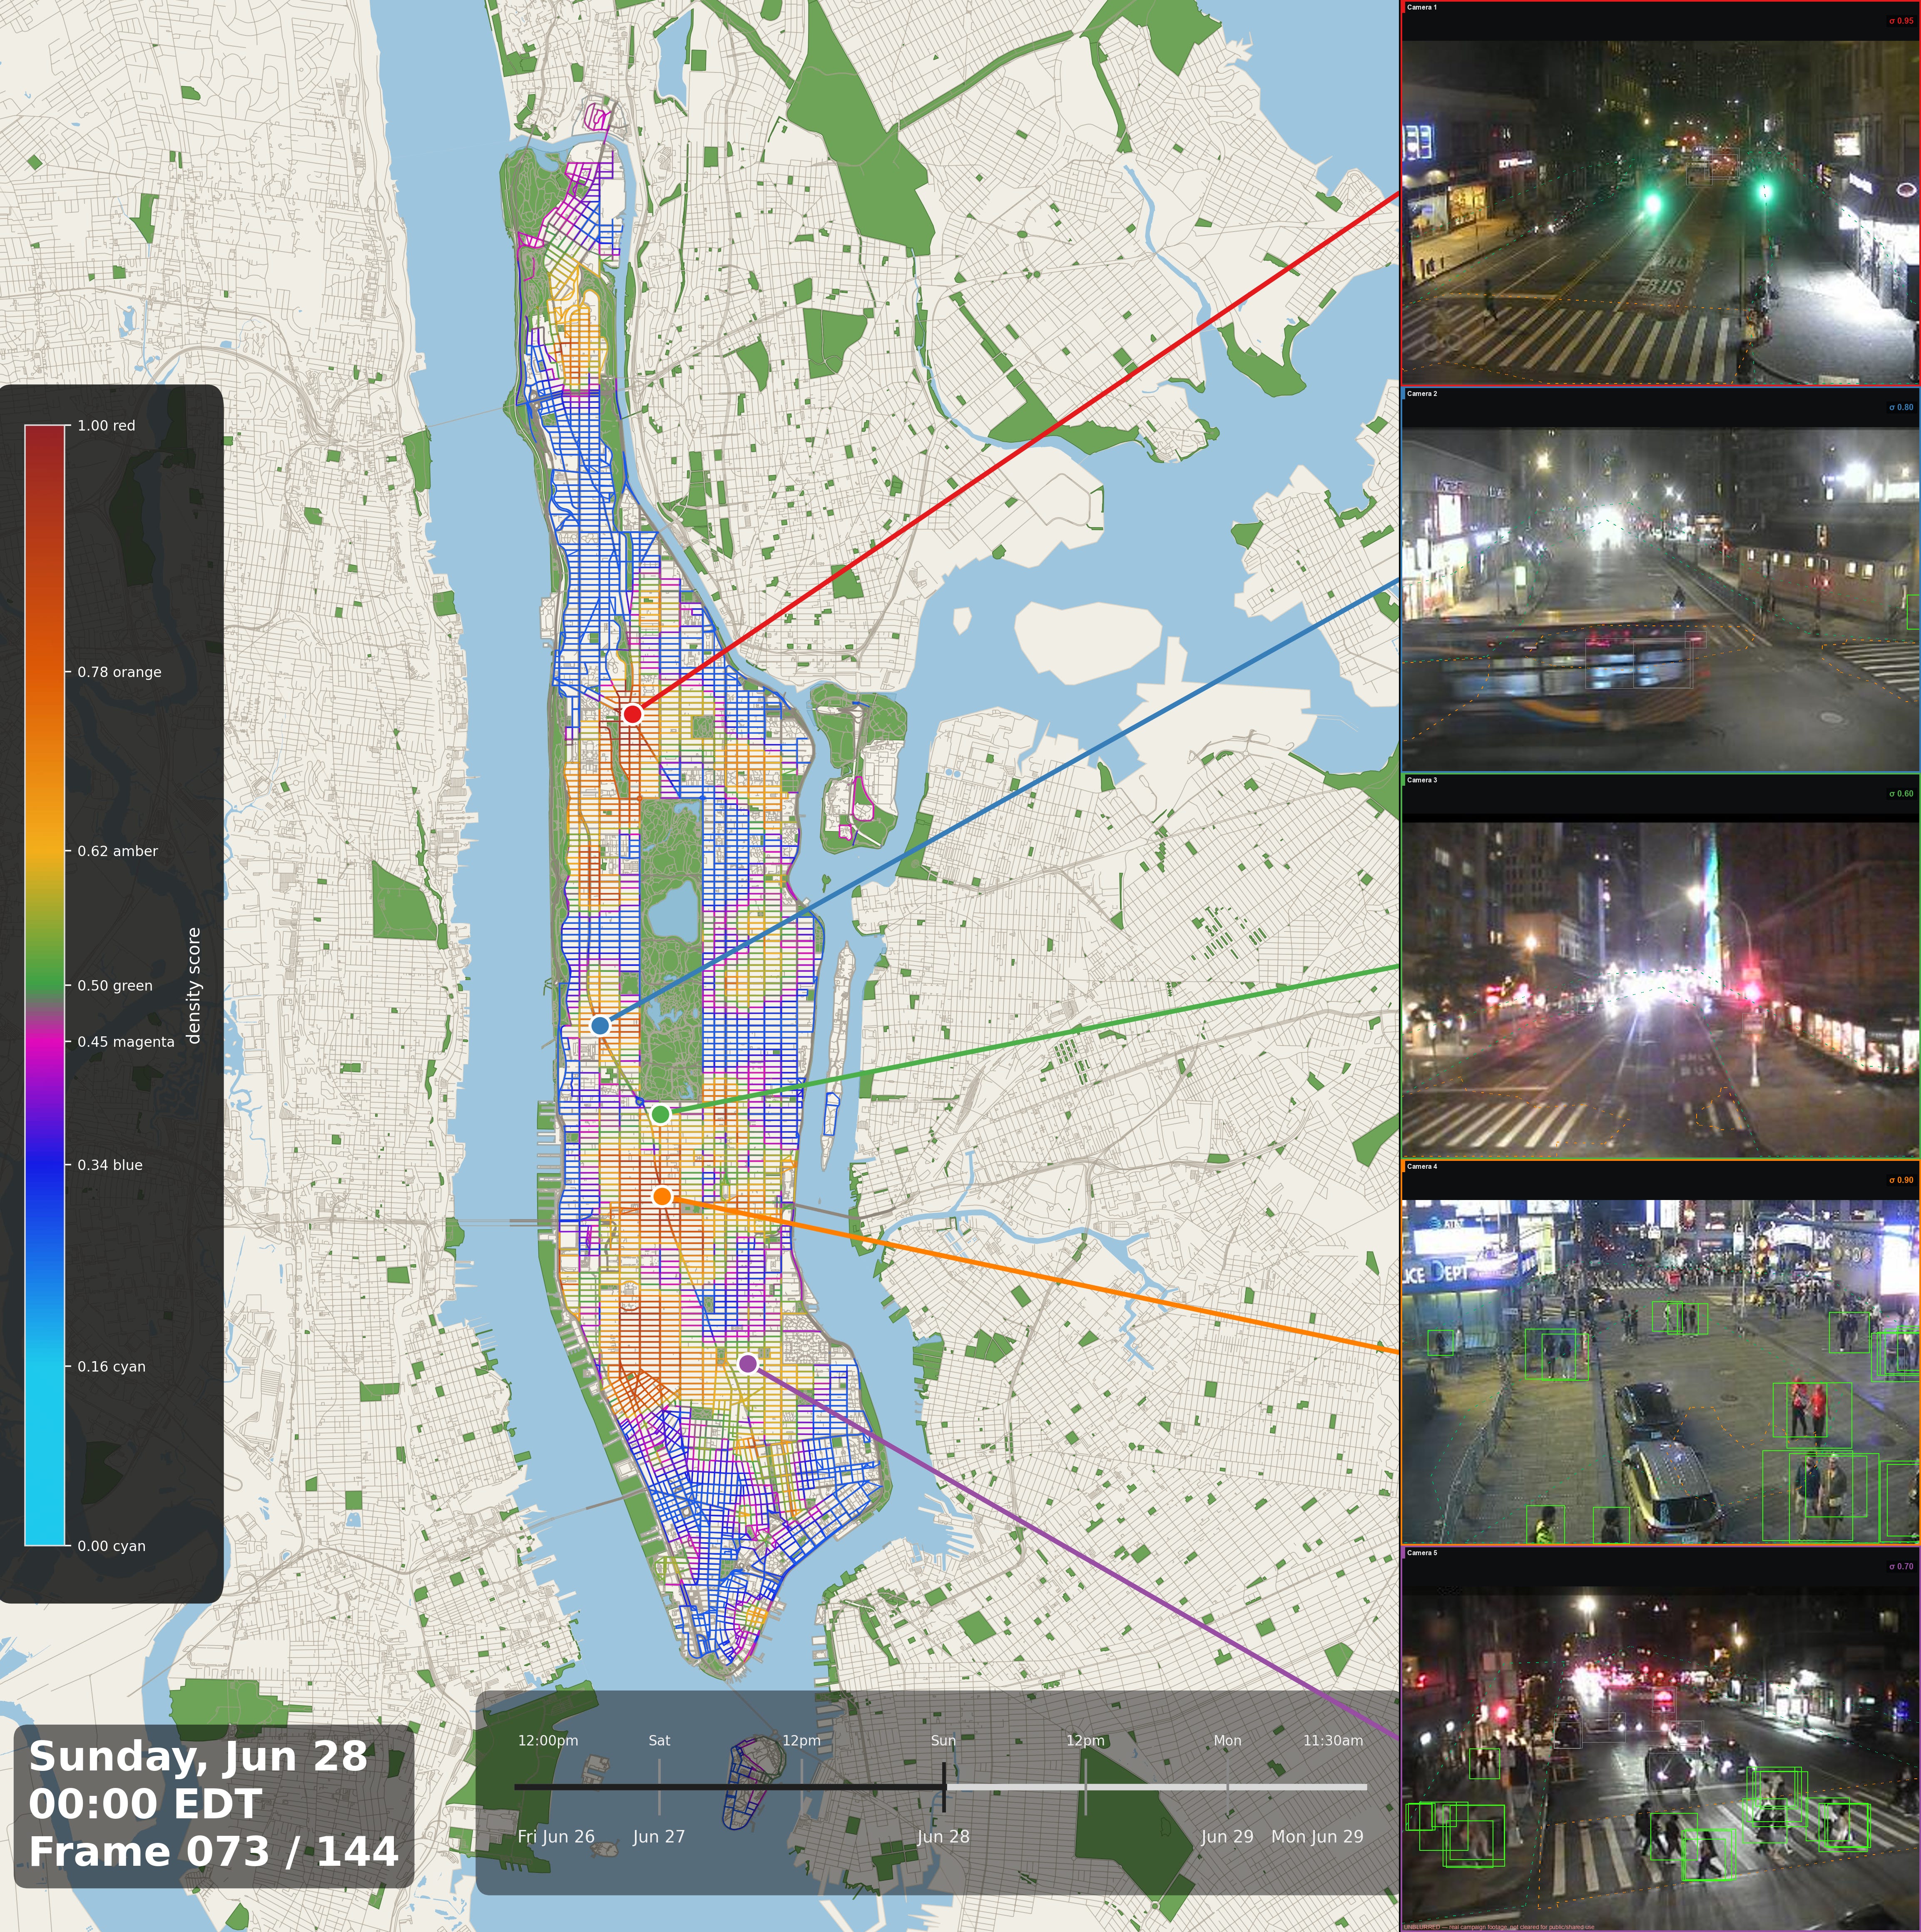
Public NYCTMC camera frames provide local sidewalk occupancy observations. Pedestrian detections inside sidewalk and crosswalk regions produce a calibrated density signal for nearby walk-graph edges.
The edge-cost model combines the occupancy signal with reconstructed shade for each walk-graph edge. The routing engine sums edge costs across every candidate path within the distance constraint, then recommends the path with the lowest total. A change in one block’s conditions can alter the cost of an entire path and produce a different recommendation.
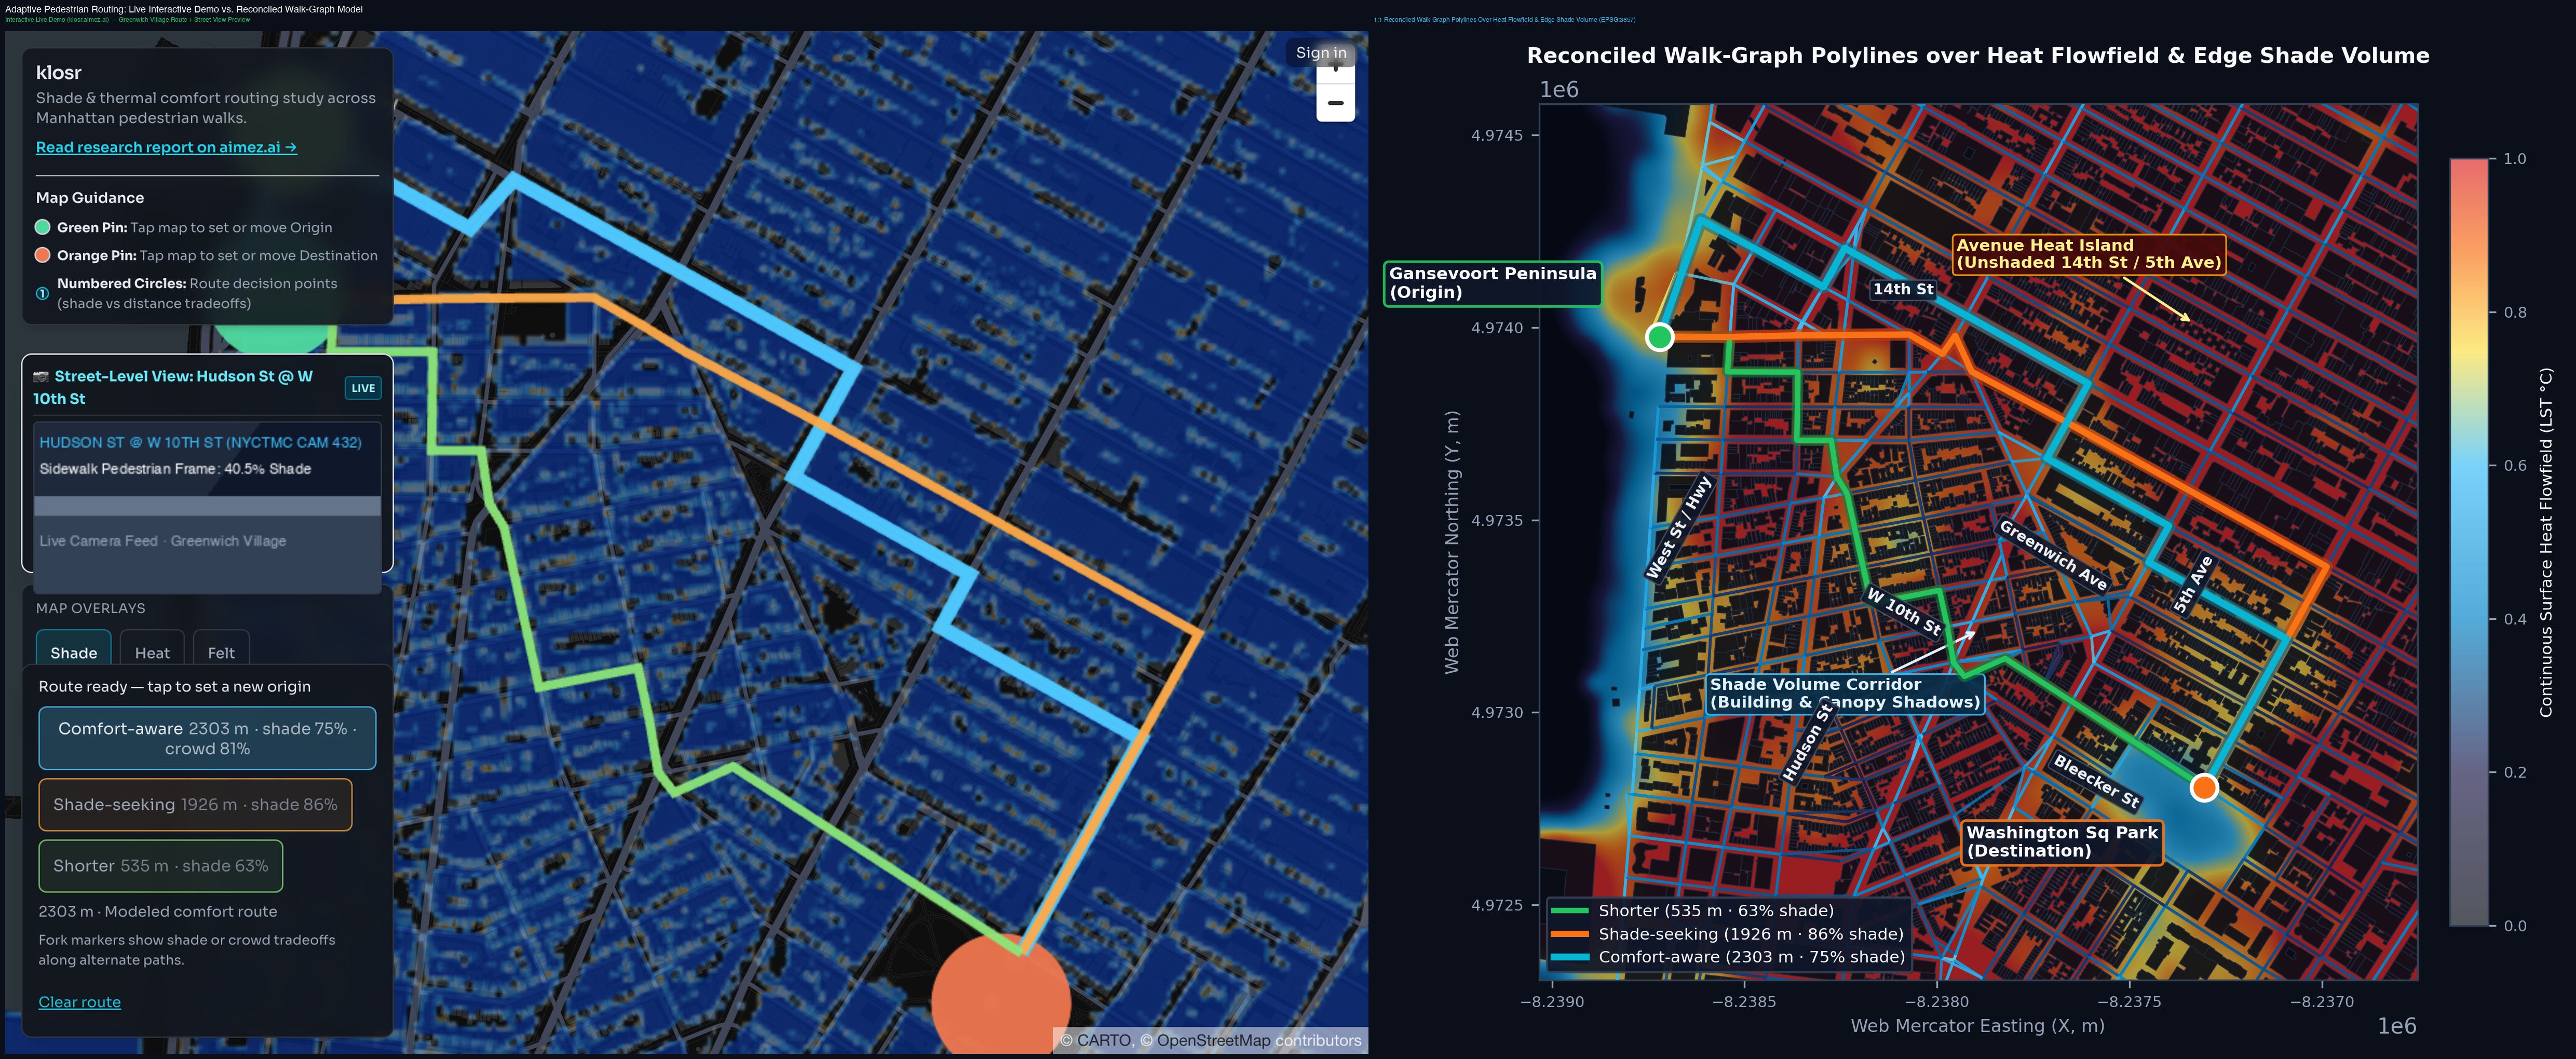
Benchmark route candidate scoring between Gansevoort Peninsula and Washington Square Park at 14:00 EDT. The shortest route measures 1,808 m with 53% length-weighted shade coverage, while the shade-seeking route extends the walk to 1,926 m and reaches 86% shade coverage, gaining 33 percentage points of shade for a 6.53% distance increase.
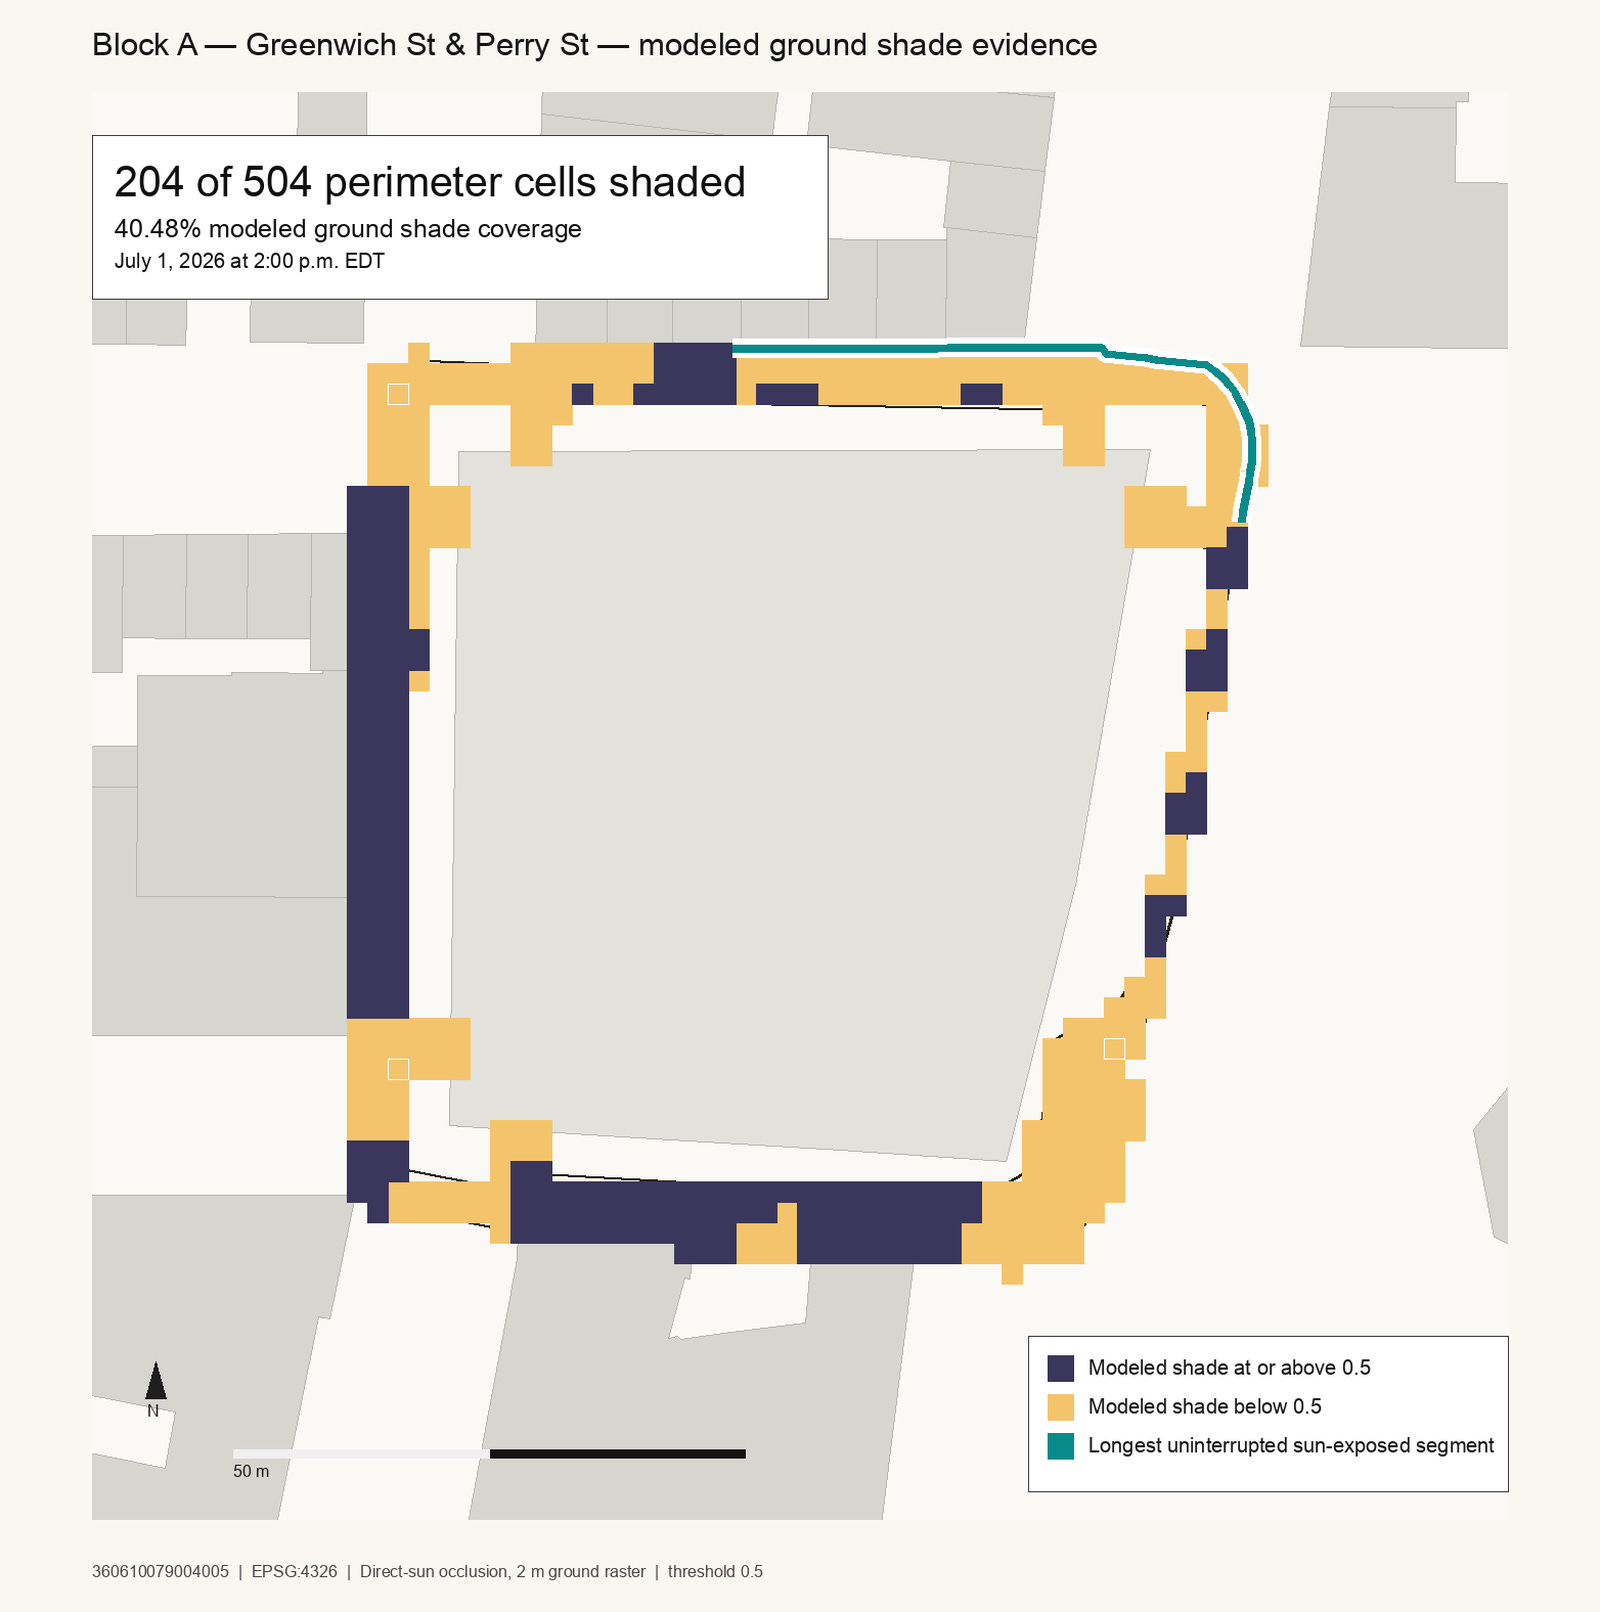
Reconstructed ground shade at Greenwich Street and Perry Street, 2:00 p.m. A 2-meter grid computes direct sunlight across the sidewalk and finds 204 of 504 squares shaded, 40.48% shade coverage.
Solar position determines the path of each ray. Building massing and canopy geometry determine whether the ray reaches the ground. The resulting shade values become exposure costs on nearby walk-graph edges, where each path accumulates the conditions encountered along its route.
By integrating calculable solar exposure with street-level pedestrian activity, the pipeline constructs dynamic edge costs across time. Camera-derived density fields provide the observed state for research evaluation, while Field-JEPA estimates the field 30 minutes later to test whether recent observations carry enough information to anticipate near-term crowding.
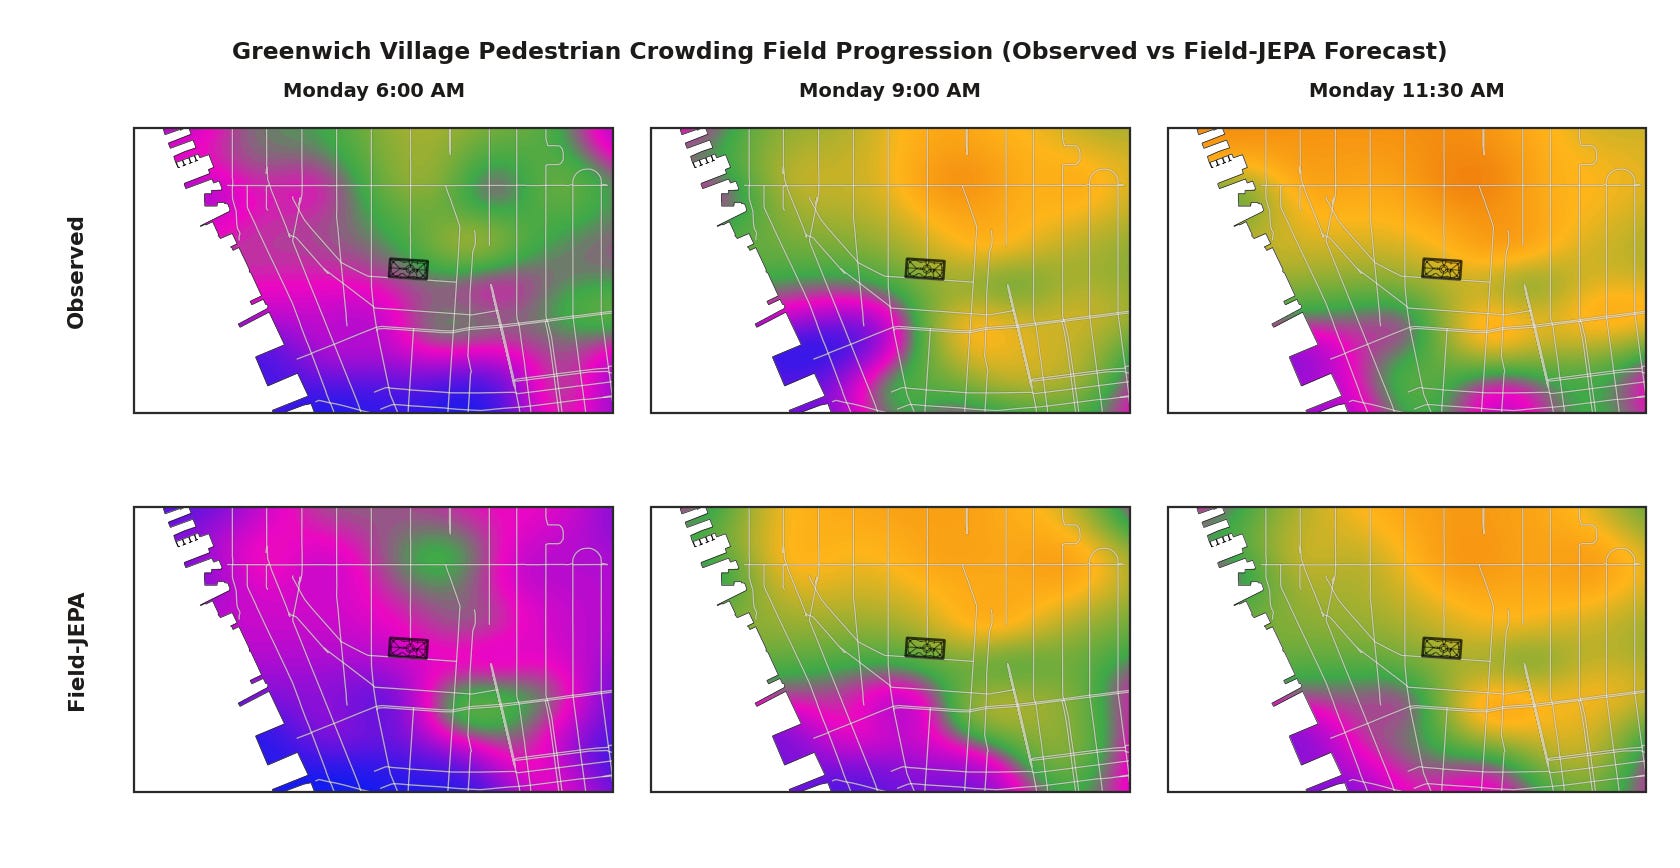
Observed pedestrian-density fields across three Monday morning holdout windows appear above their Field-JEPA 30-minute forecasts. The forecasts come from an offline research evaluation and do not drive the current routing demo.
In offline evaluation across 32 holdout windows spanning 339 Manhattan camera locations, Field-JEPA achieves a mean absolute error of 0.0901 in crowding rank at the 30-minute horizon, compared to 0.1050 for the persistence baseline. This represents a 14.2% reduction in forecast error, with a Spearman rank correlation of 0.725 between predicted and observed crowding.
Borough expansion and spatial transfer
The initial deployment covers pedestrian routing in Manhattan. Extending coverage across New York City will test whether the spatial pipeline transfers across new boroughs as local shade and occupancy datasets come online. Replicating the system in another city will require constructing and validating local street observations first. Vehicle routing will require a distinct condition model because driving constraints differ fundamentally from walking.
Storefront placement and site selection
Expanding spatial coverage increases the footprint over which block-level sidewalk occupancy can be compared. Upcoming commercial pilots will test a ranking model that matches campaign briefs against host-controlled storefront surfaces using local foot-traffic data. Recorded placement outcomes will link street conditions to campaign performance, creating an empirical record for future site selection. Property economics and leasing constraints will require separate financial models before site selection becomes a standalone product.
Take a klosr look
Early access registration for klosr is now open. Sign up for release updates and preview access as the Manhattan pilot rolls out. Commercial partners and research evaluators can indicate interest through the same form.